Charts & Graphs
Posted in visualizations on October 11, 2011
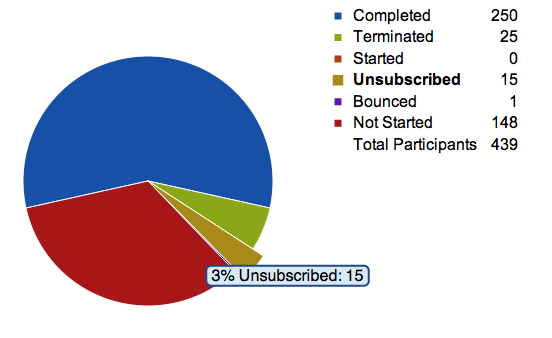
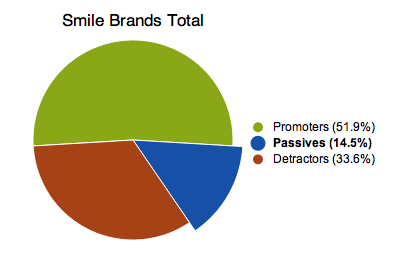
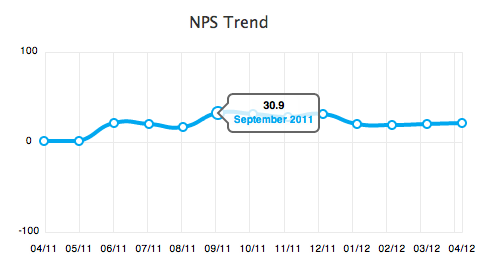
Its almost always easier to understand data when you can visualize it. To help make data more understandable for the Smile Brands reporting portal, I implemented some charts with the Raphaël.js library.
I also had been meddling with the Raphaël library earlier while working on the SRT.